A vital part of becoming a successful trader lies in using the right tools to identify high probability, low-risk trading & investing opportunities.
Our proprietary tools and resources can help you apply your knowledge, validate your trading and investing decisions, and accelerate your learning curve.
An advanced yet easy-to-use trading and investing platform that has been tested by many veteran traders offers a plethora of functions! You can;
A Powerful tool built for Options traders that tells you how cheap or expensive the Options premiums are at any given point in time for a particular stock and ascertain the Options volatility of that stock before buying or selling Options.
With IV Scanner you can find out whether stock Options premium are cheap or expensive at the click of a button and plan Options strategies.
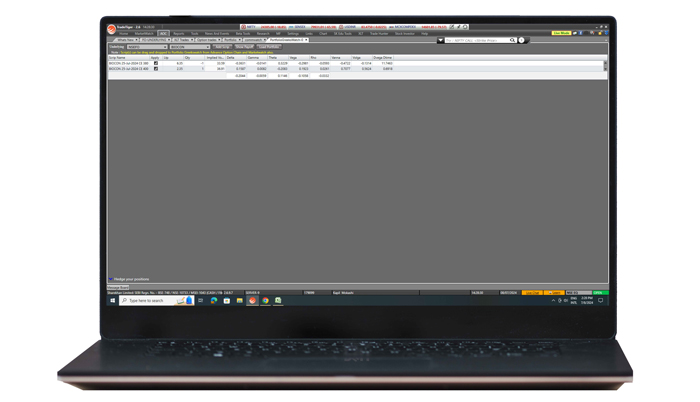
Have a strategy in mind? Just input the strategy in our “Portfolio Greek Watch“ & the tool will automatically estimate your max loss, max profit, and breakeven. No more tedious manual calculations!
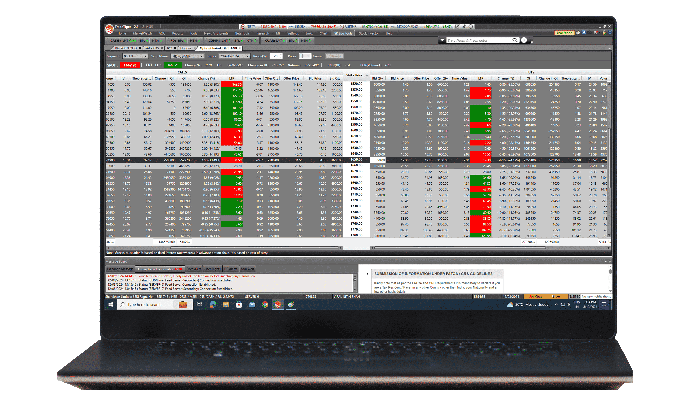
Analyse the dynamic Options chain data during market hours with Options chain. It tells you the key levels in the market to watch on a particular day & where the ‘Open Interest’ is added or reduced.
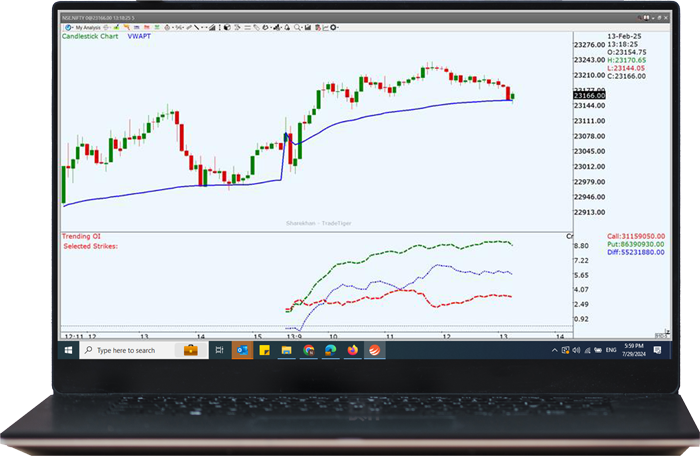
Primarily for day traders, this tool tracks positions built up in Options by big players on a live basis during market hours. If the put writers > call writers (i.e. Green line is above the red line) & prices are above the VWAP line, the trending OI signals a potential long opportunity & if the call writers > put writers (i.e. Red line is above the green line) & prices are below the VWAP line the trending OI signals a potential shorting opportunity. The indicator can be used for Intraday trading in stocks, indices as well as Intraday trading in Call & Put Options.
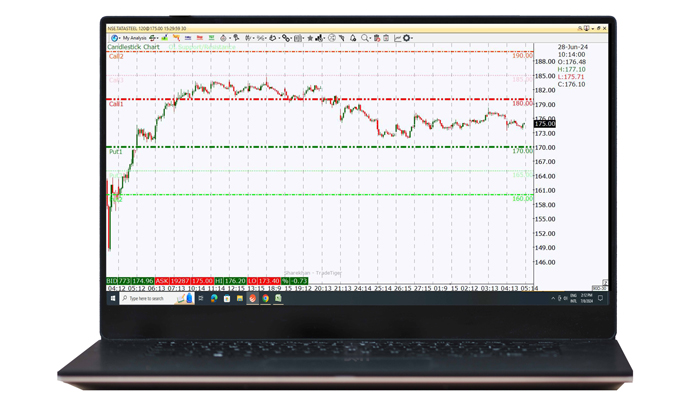
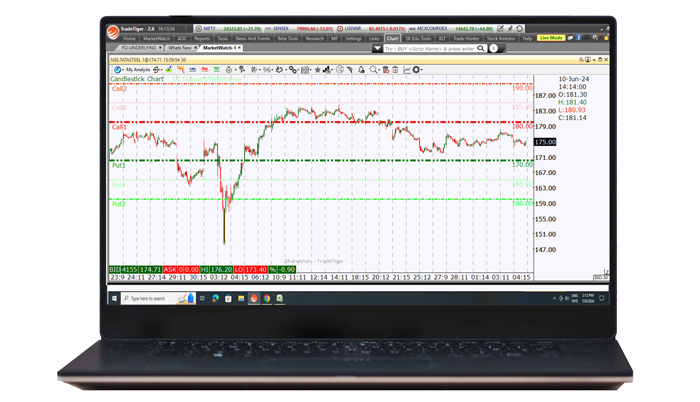
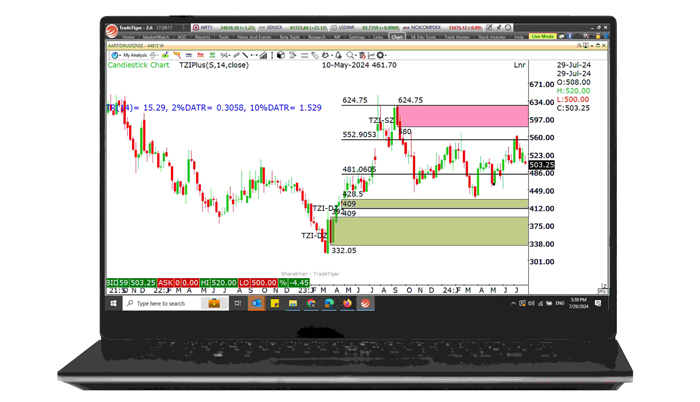
Helps analyse the major area of support & resistance on the price charts based on the positions built up in the Options chain. Call 1, Call 2, & Call 3 signal 3 resistance areas above the current market price whereas Put1, Put 2 & Put 3 signal 3 support areas below the current price. When used in conjunction with our proprietary Demand & Supply strategy one can identify high probability support/resistance areas on the price charts.
Trade Zone Identifier helps you decide what quantity of a stock to buy or sell when initiating a trade based on the risk you take. Control your risk, maximize your reward!
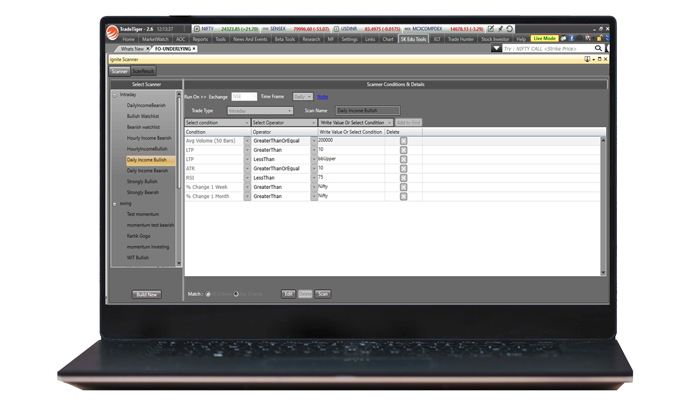
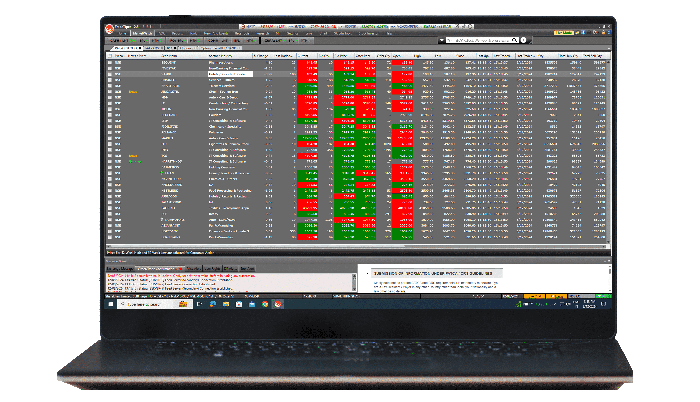
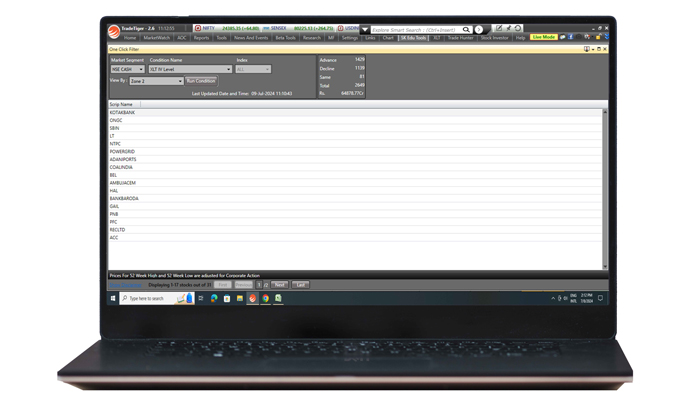
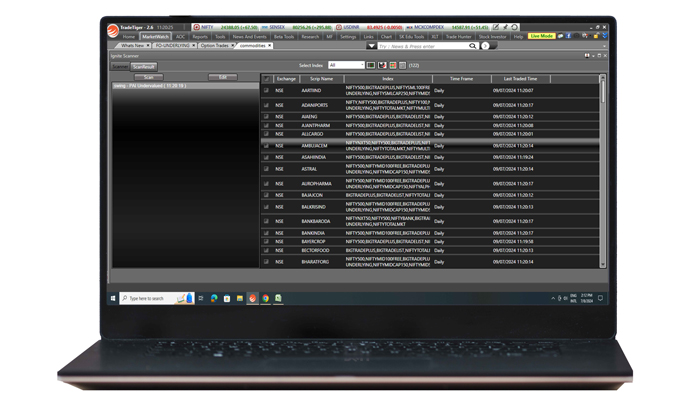
Have a problem in picking the right stocks for Intraday or Swing trading? Our scanner makes the job of filtering out the quality stocks to trade easier for you. You can also customise the scanner as per your requirements.
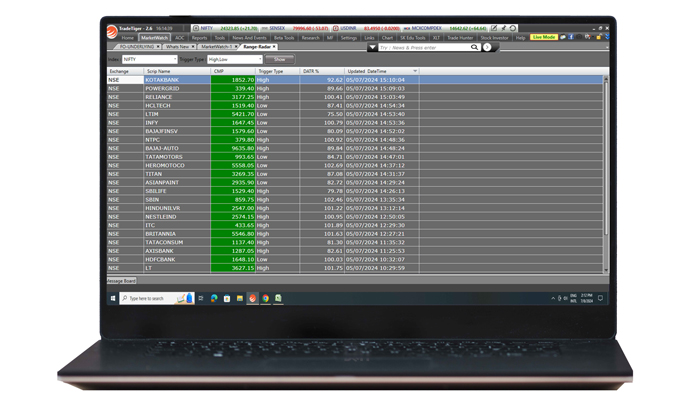
Helps identify early reversals in stock prices. Alerts the trader when a stock has completed 80-100% of its trading range for the day allowing him to position himself for potential long/short opportunities.
Helps to understand how low or high the stock price is in order to know when to buy and sell the stock. This ensures that a trader does not end up buying after a very strong rally and does not sell after a very strong fall in the stock.
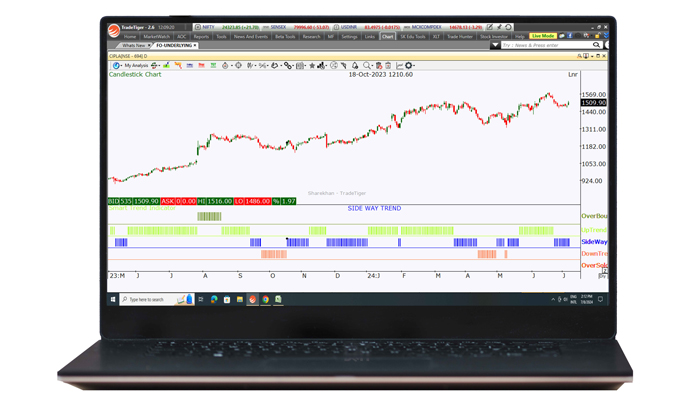
The Smart Trend Indicator helps identify the underlying trend of a stock. With a single click, a trader can easily determine whether the trend is upward, downward, or sideways. It also provides warnings when an uptrend has matured and the stock is overbought, or when a downtrend has matured, and the stock is oversold.
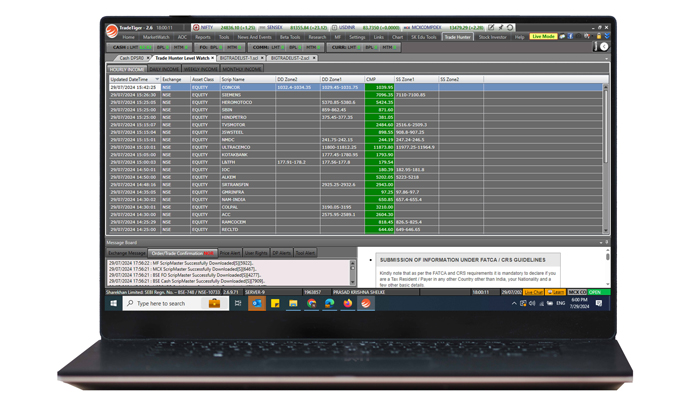
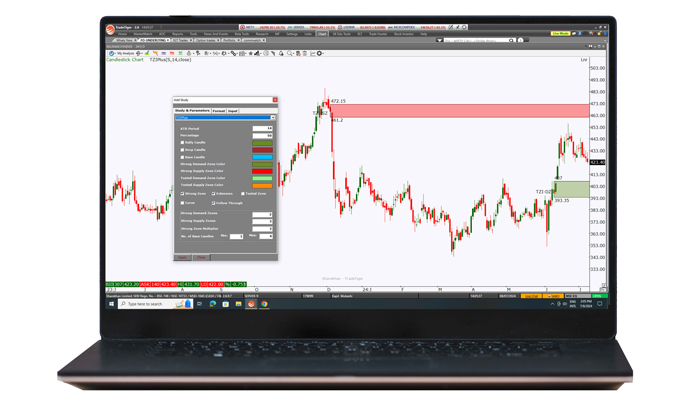
Helps to identify demand and supply zones closer to the current market price. These levels can then be combined with higher time frame charts in order to identify high probability trading opportunities.
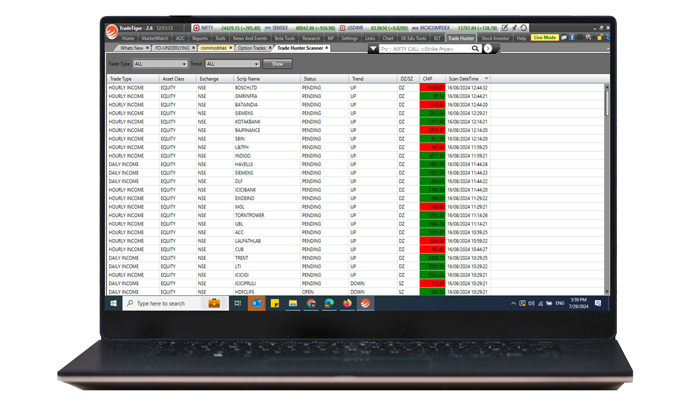
Trade hunter scanner goes one step further compared to Level Hunter & helps to identify stocks in line with the trend. With a single click, a trader can identify probable buying opportunities in an uptrend and selling opportunities in a downtrend. The scanner helps in short listing the stocks from universe of more than 200 stocks in F&O in a few mins which would have otherwise taken at least a couple of hours.

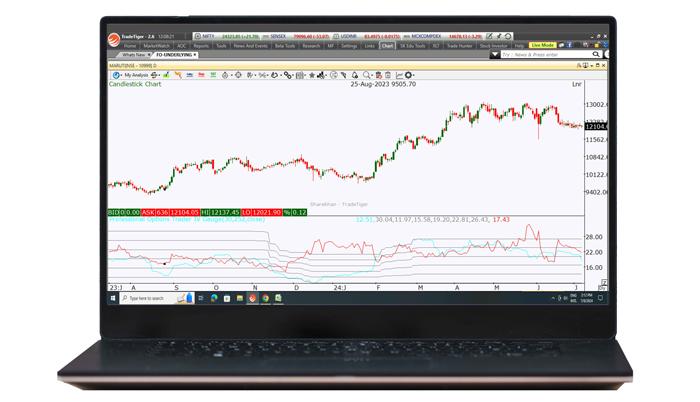
Experts often say, “Be greedy when others are fearful & be fearful when others are greedy” but how does one do that? Our Proactive Investing (PAI) indicator tool tells you just how cheap or expensive a stock is, captures important reversals points and helps you time the market more efficiently.
Wondering which stocks to invest in? Our PAI scanning tool gives a list of stocks that are available at cheap valuations at the click of a mouse. Combine these stocks with our TZI tool to enhance your odds.
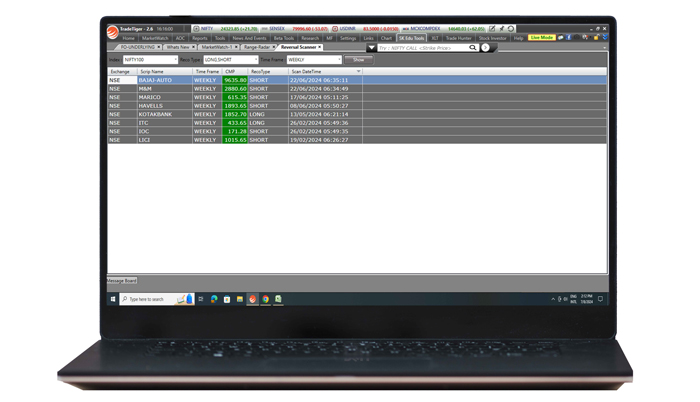
Designed for swing & positional traders the reversal scanner alerts the trader when the stock has become overstretched on the upside or downside indicating a potential reversal. When used in conjunction with Demand & Supply trading strategy, the tool can significantly increase trading odds.